Someone on #photogeeks posed an interesting question this morning. Basically asking if people with telephoto lenses shot mostly at the minimum or maximum focal length all the time rather than in between. I thought it would be a neat graph to see.All of the data that I would need to great a chart based on was ready to collect in the EXIF data within the images, I just needed to collect it. So I wrote a script that would scrape, collect and parse the "Focal Length" tag as well as the "Image Digitized" tag. It took only a matter of minutes to get a simple script working. This data was put into Excel and graphed, and the results are very interesting.
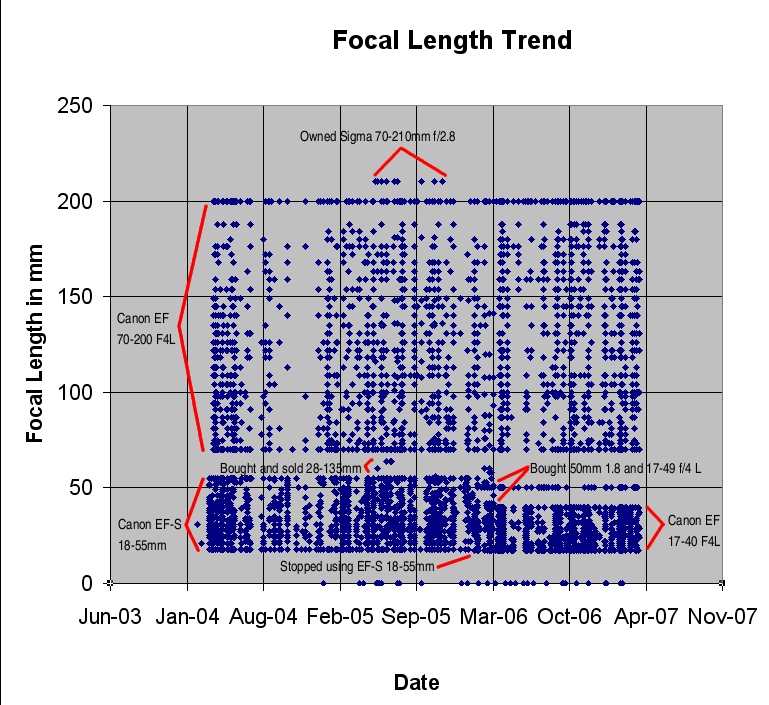
There are a few obvious things I can make out from these graphs:
- I have gaps in my focal range
- I use all ranges of focal length of my lenses
- You can see when I bought new lenses and stopped using others
- There is a curious gap between 190 and 200mm?
 |
| Click for original size |
 |
| Click for original size (Annotated) |
Here's the crude script I wrote to collect the data into a format that Excel could process. Yes, I'm aware there are a million other better ways to do this:
for file in `find . -name "crw_????.jpg"`; do
     exiftags -a $file |
     egrep "Focal Length|Digitized" |
     tac| awk '{print $3" "$4}' | xargs -n 4
done 2> /dev/null | grep -v "^$" |
 sort -n | sed -e "s/mm//" -e "s/^(.*) /1/" |
 awk '{print $1" "$2"t"$3}' | sed -e "s/^(....):(..):/1/2//" > file-for-excel.txt
|
And for those who asked, I've created the same data in a Logrithmic Plot.

